Difference between revisions of "PHP Accelerator"
| Line 2: | Line 2: | ||
If you run your own LAMP server with PHP applications, then please install it. The [[Moodle]] documentation includes information on [http://docs.moodle.org/en/Installing_APC_in_Windows setting up APC]; including testing before and after performance with "[http://httpd.apache.org/docs/2.0/programs/ab.html Apache Bench]" | If you run your own LAMP server with PHP applications, then please install it. The [[Moodle]] documentation includes information on [http://docs.moodle.org/en/Installing_APC_in_Windows setting up APC]; including testing before and after performance with "[http://httpd.apache.org/docs/2.0/programs/ab.html Apache Bench]" | ||
| + | |||
| + | The Cerberus wiki also describes Memcache in addition to APC. Their graphics illustrate the chain of execution for request processing http://wiki.cerb4.com/wiki/Performance | ||
== Installation == | == Installation == | ||
| Line 38: | Line 40: | ||
# Restart Apache | # Restart Apache | ||
# Use the Apache Bench tool to test performance with and without APC enabled. | # Use the Apache Bench tool to test performance with and without APC enabled. | ||
| + | |||
| + | == Results == | ||
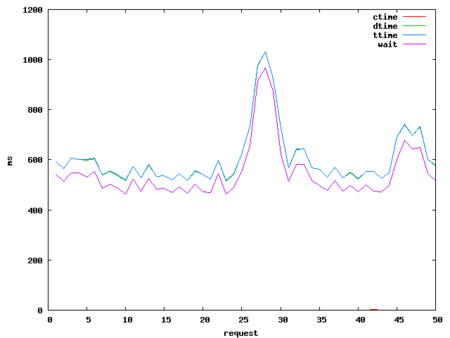
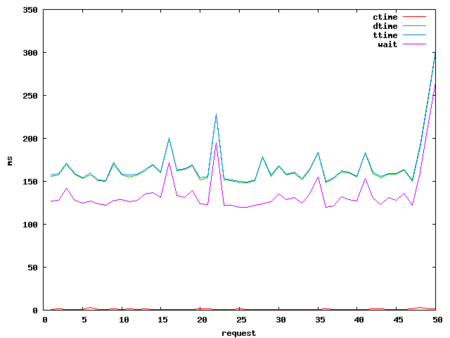
| + | Here are the results of a simple benchmark. Without APC, the request response times averaged around 600 milliseconds while with APC, they were around 150 milliseconds so APC reduced response times by 75% | ||
| + | [[Image:Http-benchmark-without-apc.png|450px|thumb|right|Without APC]] | ||
| + | [[Image:Http-benchmark-with-apc.png|450px|thumb|right|With APC]] | ||
== Notes == | == Notes == | ||
APC, aside from speeding up your website, also provides a storage mechanism outside the traditional cookie/session mechanism. So, you could set an application variable or constant and (assuming that the cache is not cleared, etc.) retrieve that value from another context. | APC, aside from speeding up your website, also provides a storage mechanism outside the traditional cookie/session mechanism. So, you could set an application variable or constant and (assuming that the cache is not cleared, etc.) retrieve that value from another context. | ||
| + | |||
| + | The graphs were produced using '''ab''' and '''gnuplot''' ab is Apache Bench, a benchmarking and stress-testing tool. Using -g to produce CSV output suitable for feeding to spreadsheets or gnuplot, you can generate the graphs. | ||
| + | <source lang="bash"> | ||
| + | ab -g ~/ab-without-apc.csv -n 50 -c 1 http://freephile.com/wiki/index.php/Main_Page | ||
| + | </source> | ||
| + | produces this output: | ||
| + | <pre> | ||
| + | This is ApacheBench, Version 2.0.40-dev <$Revision: 1.146 $> apache-2.0 | ||
| + | Copyright 1996 Adam Twiss, Zeus Technology Ltd, http://www.zeustech.net/ | ||
| + | Copyright 2006 The Apache Software Foundation, http://www.apache.org/ | ||
| + | |||
| + | Benchmarking freephile.com (be patient).....done | ||
| + | |||
| + | |||
| + | Server Software: Apache | ||
| + | Server Hostname: freephile.com | ||
| + | Server Port: 80 | ||
| + | |||
| + | Document Path: /wiki/index.php/Main_Page | ||
| + | Document Length: 15778 bytes | ||
| + | |||
| + | Concurrency Level: 1 | ||
| + | Time taken for tests: 30.313117 seconds | ||
| + | Complete requests: 50 | ||
| + | Failed requests: 0 | ||
| + | Write errors: 0 | ||
| + | Total transferred: 815850 bytes | ||
| + | HTML transferred: 788900 bytes | ||
| + | Requests per second: 1.65 [#/sec] (mean) | ||
| + | Time per request: 606.262 [ms] (mean) | ||
| + | Time per request: 606.262 [ms] (mean, across all concurrent requests) | ||
| + | Transfer rate: 26.26 [Kbytes/sec] received | ||
| + | |||
| + | Connection Times (ms) | ||
| + | min mean[+/-sd] median max | ||
| + | Connect: 1 1 0.1 1 2 | ||
| + | Processing: 515 604 113.4 567 1030 | ||
| + | Waiting: 464 546 109.6 513 967 | ||
| + | Total: 516 605 113.4 568 1031 | ||
| + | |||
| + | Percentage of the requests served within a certain time (ms) | ||
| + | 50% 568 | ||
| + | 66% 600 | ||
| + | 75% 608 | ||
| + | 80% 644 | ||
| + | 90% 734 | ||
| + | 95% 925 | ||
| + | 98% 1031 | ||
| + | 99% 1031 | ||
| + | 100% 1031 (longest request) | ||
| + | </pre> | ||
| + | |||
| + | Then, by invoking gnuplot, you can create the graphs: | ||
| + | <pre> | ||
| + | gnuplot> set terminal png | ||
| + | Terminal type set to 'png' | ||
| + | Options are 'nocrop medium ' | ||
| + | gnuplot> set output "http-benchmark-with-apc.png" | ||
| + | gnuplot> set xlabel "request" | ||
| + | gnuplot> set ylabel "ms" | ||
| + | gnuplot> plot "/home/greg/ab-with-apc.csv" using 7 with lines title "ctime", \ | ||
| + | > "/home/greg/ab-with-apc.csv" using 8 with lines title "dtime", \ | ||
| + | > "/home/greg/ab-with-apc.csv" using 9 with lines title "ttime", \ | ||
| + | > "/home/greg/ab-with-apc.csv" using 10 with lines title "wait" | ||
| + | gnuplot> set output "http-benchmark-without-apc.png" | ||
| + | gnuplot> plot "/home/greg/ab-without-apc.csv" using 7 with lines title "ctime", \ | ||
| + | > "/home/greg/ab-without-apc.csv" using 8 with lines title "dtime", \ | ||
| + | > "/home/greg/ab-without-apc.csv" using 9 with lines title "ttime", \ | ||
| + | > "/home/greg/ab-without-apc.csv" using 10 with lines title "wait" | ||
| + | </pre> | ||
[[Category:Apache]] | [[Category:Apache]] | ||
[[Category:PHP]] | [[Category:PHP]] | ||
| + | [[Category:Wiki]] | ||
| + | [[Category:Sysadmin]] | ||
Revision as of 12:45, 16 October 2008
A PHP Acelerator is a tool that will enhance the performance of web applications written for the PHP scripting language. The free Alternative PHP Cache (APC) is distributed as a PEAR package.
If you run your own LAMP server with PHP applications, then please install it. The Moodle documentation includes information on setting up APC; including testing before and after performance with "Apache Bench"
The Cerberus wiki also describes Memcache in addition to APC. Their graphics illustrate the chain of execution for request processing http://wiki.cerb4.com/wiki/Performance
Installation[edit | edit source]
Assuming you already have Apache2 and PHP5 (with dev extensions so PECL can run phpize), it's as easy as
# make sure we have the development headers and apxs2 binary for threaded versions of apache2
sudo apt-get install apache2-threaded-dev
# install the APC extension
sudo pecl install APC
# pecl would have updated my php.ini file automatically, but it did not know where to look.
# set it for future reference
sudo pear config-set php_ini /etc/php5/apache2/php.ini
# do the configuration of php settings file myself
sudo vi /etc/php5/apache2/php.ini
# test and restart apache
sudo apache2ctl configtest
sudo apache2ctl graceful
# make a symbolic link to the system front-end
cd /var/www
sudo ln -s /usr/share/php/apc.php
MediaWiki[edit | edit source]
MediaWiki can take advantage of the APC cache if you tell it to. see The Manual for cache settings, and set mw:Manual:$wgMainCacheType in LocalSettings.php:
$wgMainCacheType = CACHE_ACCEL;
Troubleshooting[edit | edit source]
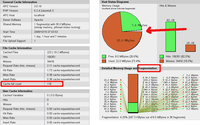
If you notice sluggishness in your site after installing APC, then check out the front-end (apc.php). The sure sign that you need to increase your cache size is that the "cache full" count is greater than one.
- Check your memory
- Increase the Shared Memory Size for APC in your php.ini file e.g.
apc.shm_size = 128 - Restart Apache
- Use the Apache Bench tool to test performance with and without APC enabled.
Results[edit | edit source]
Here are the results of a simple benchmark. Without APC, the request response times averaged around 600 milliseconds while with APC, they were around 150 milliseconds so APC reduced response times by 75%
Notes[edit | edit source]
APC, aside from speeding up your website, also provides a storage mechanism outside the traditional cookie/session mechanism. So, you could set an application variable or constant and (assuming that the cache is not cleared, etc.) retrieve that value from another context.
The graphs were produced using ab and gnuplot ab is Apache Bench, a benchmarking and stress-testing tool. Using -g to produce CSV output suitable for feeding to spreadsheets or gnuplot, you can generate the graphs.
ab -g ~/ab-without-apc.csv -n 50 -c 1 http://freephile.com/wiki/index.php/Main_Page
produces this output:
This is ApacheBench, Version 2.0.40-dev <$Revision: 1.146 $> apache-2.0
Copyright 1996 Adam Twiss, Zeus Technology Ltd, http://www.zeustech.net/
Copyright 2006 The Apache Software Foundation, http://www.apache.org/

Benchmarking freephile.com (be patient).....done


Server Software:        Apache
Server Hostname:        freephile.com
Server Port:            80

Document Path:          /wiki/index.php/Main_Page
Document Length:        15778 bytes

Concurrency Level:      1
Time taken for tests:   30.313117 seconds
Complete requests:      50
Failed requests:        0
Write errors:           0
Total transferred:      815850 bytes
HTML transferred:       788900 bytes
Requests per second:    1.65 [#/sec] (mean)
Time per request:       606.262 [ms] (mean)
Time per request:       606.262 [ms] (mean, across all concurrent requests)
Transfer rate:          26.26 [Kbytes/sec] received

Connection Times (ms)
              min  mean[+/-sd] median   max
Connect:        1    1   0.1      1       2
Processing:   515  604 113.4    567    1030
Waiting:      464  546 109.6    513     967
Total:        516  605 113.4    568    1031

Percentage of the requests served within a certain time (ms)
  50%    568
  66%    600
  75%    608
  80%    644
  90%    734
  95%    925
  98%   1031
  99%   1031
 100%   1031 (longest request)
Then, by invoking gnuplot, you can create the graphs:
gnuplot> set terminal png
Terminal type set to 'png'
Options are 'nocrop medium '
gnuplot> set output "http-benchmark-with-apc.png"
gnuplot> set xlabel "request"
gnuplot> set ylabel "ms"
gnuplot> plot "/home/greg/ab-with-apc.csv" using 7 with lines title "ctime", \
> "/home/greg/ab-with-apc.csv" using 8 with lines title "dtime", \
> "/home/greg/ab-with-apc.csv" using 9 with lines title "ttime", \
> "/home/greg/ab-with-apc.csv" using 10 with lines title "wait"
gnuplot> set output "http-benchmark-without-apc.png"
gnuplot> plot "/home/greg/ab-without-apc.csv" using 7 with lines title "ctime", \
> "/home/greg/ab-without-apc.csv" using 8 with lines title "dtime", \
> "/home/greg/ab-without-apc.csv" using 9 with lines title "ttime", \
> "/home/greg/ab-without-apc.csv" using 10 with lines title "wait"


