Search results
From Freephile Wiki
- Kubernetes (section Chart Repositories)https://charts.bitnami.com/ (nothing to see there). The GitHub repo is https://github.com/bitnami/charts Each cloud provider has customized their offerings...7 KB (899 words) - 21:17, 15 September 2025
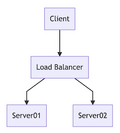
- browser. This is particularly useful if you want to collaboratively edit flow-chart diagrams online while also providing all the context and documentation about...2 KB (219 words) - 14:54, 31 December 2025
- a distinction between "Graphing" data (think Excel spreadsheets and pie charts) vs. "Diagramming" which uses data in a formal grammar or notation to produce...6 KB (842 words) - 20:51, 5 January 2026
- Pie chart (section Frontmatter with GANTT Chart)Some more examples of Mermaid diagrams and charts. The best reference for Mermaid syntax and examples is the project website at https://mermaid.js.org...1 KB (29 words) - 08:53, 31 December 2025
- easier. With simple syntax, create sophisticated diagrams, flowcharts, GANTT Charts etc. More Notes: Use the online editor to create your diagram Example: See...819 bytes (46 words) - 13:08, 16 June 2025
- 关闭 1 Comparing MediaWiki to Confluence 2 Executive Summary 3 Comparison Chart 4 Talking Points 4.1 What do they have to say? 4.2 WYSIWYG editor 4.3 Search...12 KB (725 words) - 13:28, 3 May 2023
- areas work Example: Interactive geographical maps; Clickable organizational charts; Visual navigation menus...524 bytes (0 words) - 15:25, 9 December 2025
- official emoji at the Unicode Consortium website https://www.unicode.org/emoji/charts/emoji-list.html See documentation for the maintenance script Manual:ImportImages...2 KB (270 words) - 14:01, 8 April 2025
- December 2025 Pie chart (hist | edit) [1,124 bytes] Admin (talk | contribs) (Created page with "Some more examples of Mermaid diagrams and charts. The best reference...3 KB (939 words) - 13:13, 28 June 2025
- different types of diagrams: BPMN diagrams (using the bpmn-js library) Gantt charts (using the DHTMLX Gantt JS library) DOT graphs, also known as Graphviz graphs...3 KB (393 words) - 13:03, 16 June 2025
- managing Charts. Charts are packages of pre-configured Kubernetes resources. Use Helm to: Find and use popular software packaged as Helm Charts to run in...4 KB (460 words) - 07:50, 2 August 2024
- region definitions Interactive geographical maps; Clickable organizational charts; Visual navigation menus Feature:InputBox [[File:|100px|100px|link=Feature:InputBox]]...2 KB (104 words) - 08:54, 7 September 2025
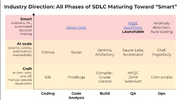
- thanks Kohsuke Kawaguchi ! Official site: https://www.jenkins.io/ Interesting chart from Aug 2024 when CloudBees acquired Launchable...403 bytes (25 words) - 10:37, 1 March 2025
- Study Castle icons Cat icons Categorizing templates Cemeteries in art Charts ChatGPT CiviCRM Cloud Code Coffin icons Collaboration Collections ...929 bytes (831 words) - 14:21, 5 June 2025
- https://gerrit.wikimedia.org/r/plugins/gitiles/releng/local-charts/ Gerrit repo for using Minikube and Helm charts to define MediaWiki local development environments...8 KB (940 words) - 23:33, 9 December 2025
- # results. # A traditional Gantt Chart for the TaskJugglerUI taskreport "Gantt Chart" { headline "Project Gantt Chart" columns hierarchindex, name, start...18 KB (2,722 words) - 15:49, 19 May 2025
- and clean up the container registry. Ease of use: use Dockerfiles and Helm chart for configuration and let werf handle all the rest. Advanced features: automatic...3 KB (368 words) - 10:40, 23 December 2025
- netzgesta.de/S5/references.php which adds auto-scaling of images, fading, sound, chart support, extended control panel and more. S9 http://slideshow-s9.github.io/...4 KB (583 words) - 07:43, 31 December 2018
- customer, you can quickly view a dashboard for reports and graphic historical charts. The easy-to-use administration tools let you add users and do other functions...5 KB (714 words) - 09:46, 4 June 2025


